


 8 / 68

Introduction
Overall the Auckland Industrial property market has a
positive trend with evidence of rental growth, record
low vacancy rates and a growing demand for quality
space with development unable to keep up. Business
confidence surveys however paint a slightly different
picture with a more pessimistic outlook highlighting
three consecutive months of negative results. This
coupled with a low paying dairy industry, a low dollar
and the slowing of the Chinese economy suggests the
good times could be letting up. However, overall signs
suggest the Auckland Industrial market is tracking well.
Rents – A Landlords Market
Landlords are becoming more aggressive in their
approach to letting up premises by contrast to
conditions two to three years prior. Tenants have to
stomach rental increases as their tenancy catches up
to market on review dates and due to the lack of stock
there are little or no options available to move.
In the absence of available and suitable prime stock
and centralised land for design and build options, some
businesses are turning to older industrial buildings and
investing heavily in fit out. An example is that of an
industrial building in Penrose with 5,080 sqm warehouse
over two levels and 440 sqm of office space. The tenant
invested in a rewire with new cable tray wiring platforms,
upgraded security and fire systems, and refurbished the
office and amenity areas; with the installation of LED
lighting, heating and ventilation systems.
Knight Frank has seen incentives half in the last twelve
months with more leases incorporating a CPI plus
percentage component in order to guarantee an
increase to the income stream and also aid tenants with
forecasting cash flow. Any leases that provide an incentive
will offer one month rent free on a term of three to four
years. All this being a sharp contrast to the GFC period
where incentives were quite prevalent.
Industrial
market overview
for Auckland
Table 1.
Sales & Investment Yields
Address
Suburb
Property Type
Price
Floor Area
Yield
Last Sales Date Prime / Secondary
Joval Place
Manukau
Industrial
$314,000.00
184
7.00%
Feb-15
Secondary
Norman Spencer Dr
Papatoetoe
Industrial
$710,000.00
401
7.00%
Feb-15
Secondary
Great South Road
Mt Welington
Industrial
$730,000.00
292
7.50%
Mar-15
Secondary
Greenpark Rd
Penrose
Industrial
$2,500,000.00
1127
6.40%
Apr-15
Secondary
Sir William Ave
East Tamaki
Industrial
$5,640,000.00
4429
7.40%
Apr-15
Secondary
Vestey Dr
Mt Welington
Industrial
$8,750,000.00
4179
6.11%
May-15
Secondary
Kerrs Rd
Wiri
Industrial
$1,080,000.00
1000
7.80%
May-15
Secondary
Great South Road
Manukau
Industrial
$7,560,000.00
1880
7.56%
May-15
Secondary
Huia Rd
Otahuhu
Industrial
$775,000.00
840
7.28%
Jun-15
Secondary
Lady Ruby Drive
East Tamaki
Industrial
$5,280,000.00
2568
5.80%
Aug-15
Prime
Ben Lomond Cr
Pakuranga
Industrial
$3,330,000.00
2450
6.50%
Aug-15
Secondary
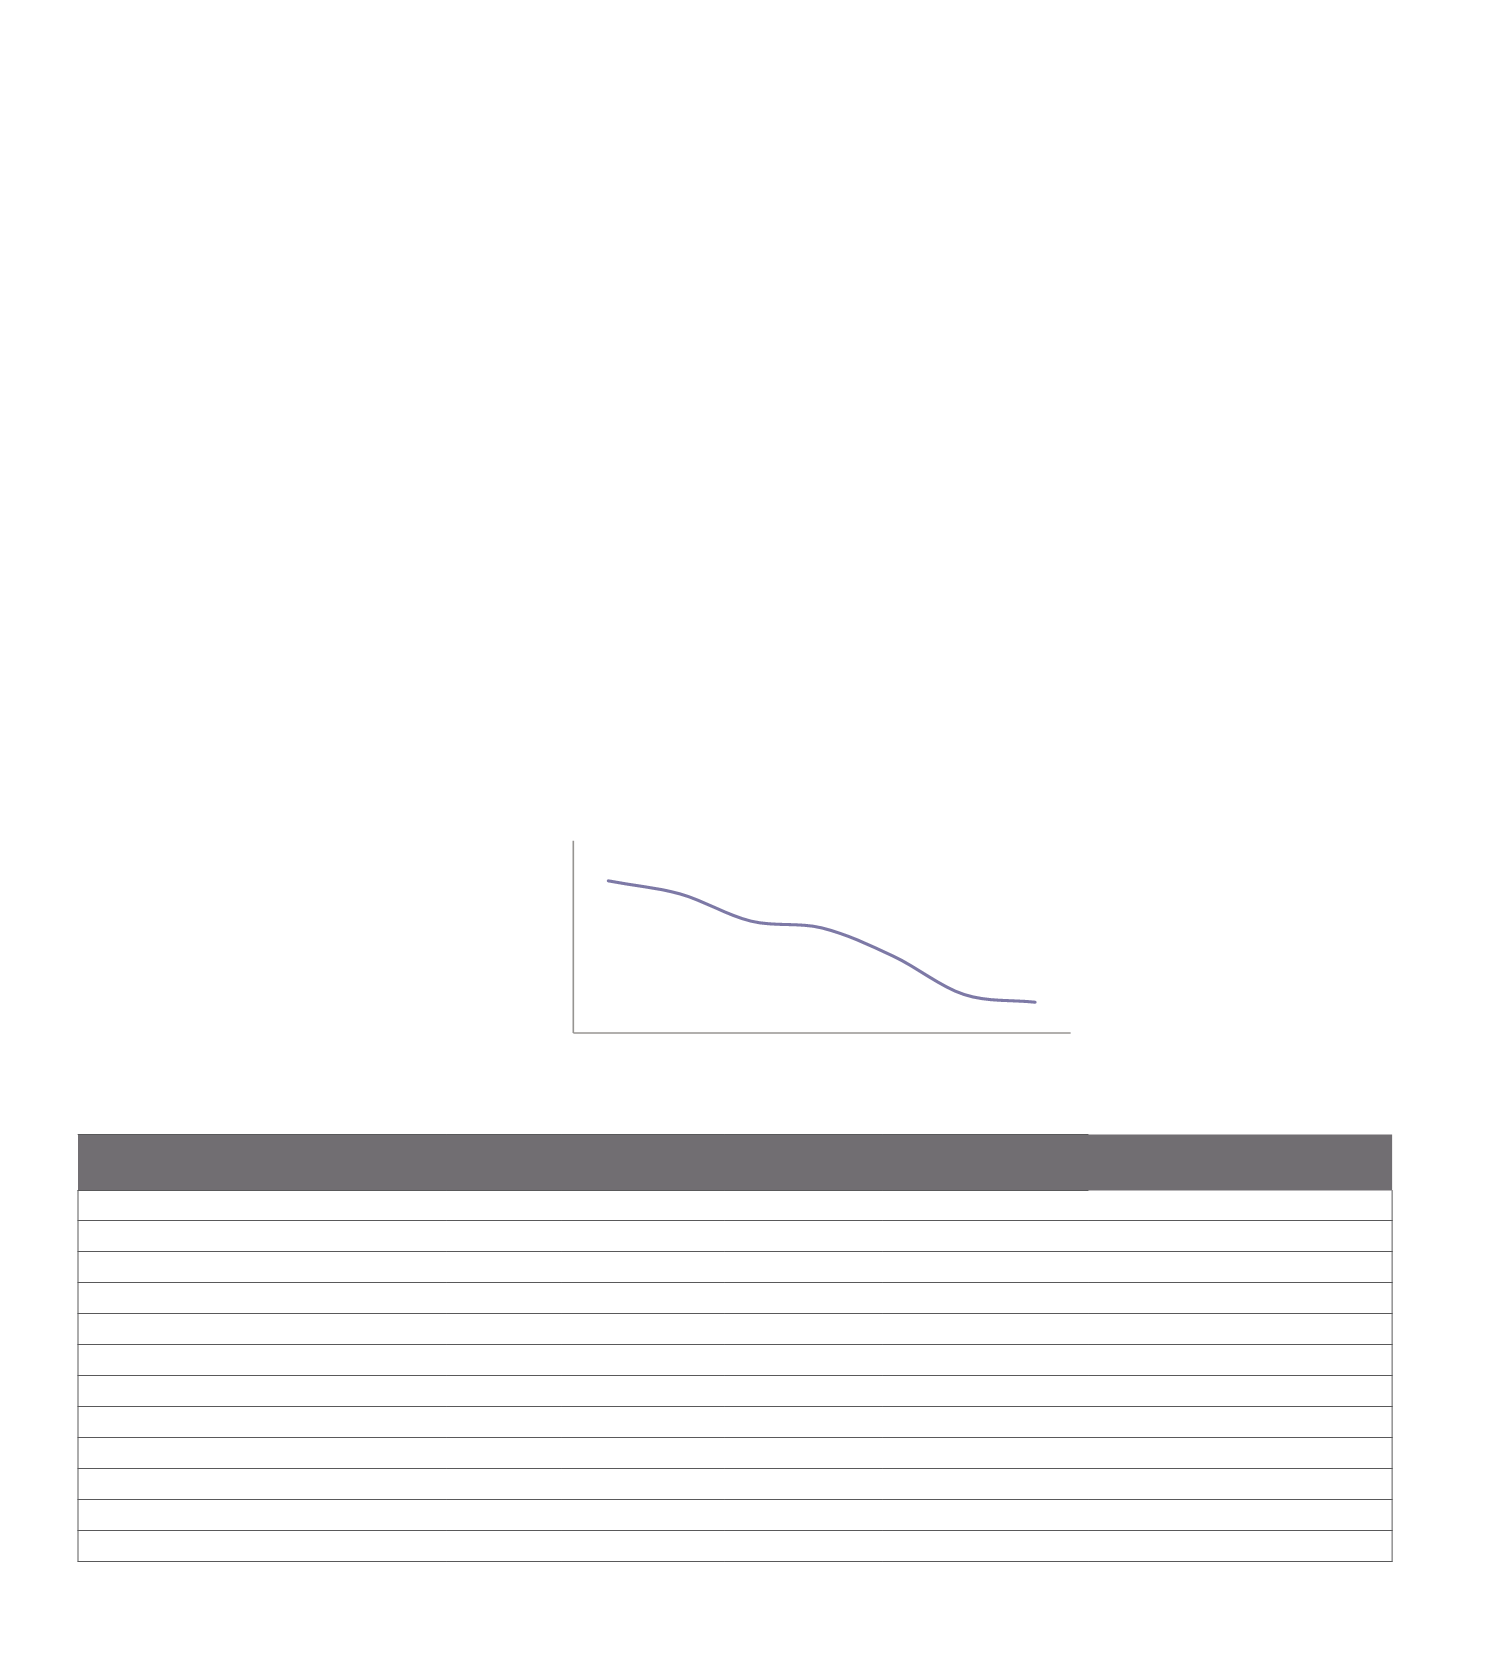
5.00
6.00
7.00
8.00
9.00
10.00
2010
2011
2012
2013
2014
2015 2016(f)
Figure 1.
Average A-Grade Industrial Yield - South Auckland
AUCKLAND
8
PROPERTY VIEW 2015