


 9 / 68

South Auckland
Prime Industrial Yields
Sale prices are rising faster than rents in the industrial
sector which in turn is pushing down yields. Knight Frank
has seen yields progressively fall with evidence of 5.75% to
6.2% (75 Lady Ruby Drive which sold vacant for $5.28m in
August, with an indicative yield of 5.75%). (Photo below)
Developers who have land banked essentially control new
supply and are seeing the benefit of their actions from
increasing land prices and an increased buyer pool of
investors seeking out modern buildings with strong tenant
covenants. The falling OCR and low interest rates are again
not helping the overall picture, coupled with the low NZD
suggest foreign investment might become more prevalent.
South Auckland Industrial
Vacancy and Stock
The vacancy rate is at a level unseen in the market place
for quite some time to which we understand it to be
around 2% with prime industrial in the vicinity of 0.5%.
In its entirety, across all grades of industrial stock,
Mt Wellington appears to show the highest level of
vacancy at approximately 4.50%, with Onehunga being
at the other end of the spectrum at a rate of 0.65%.
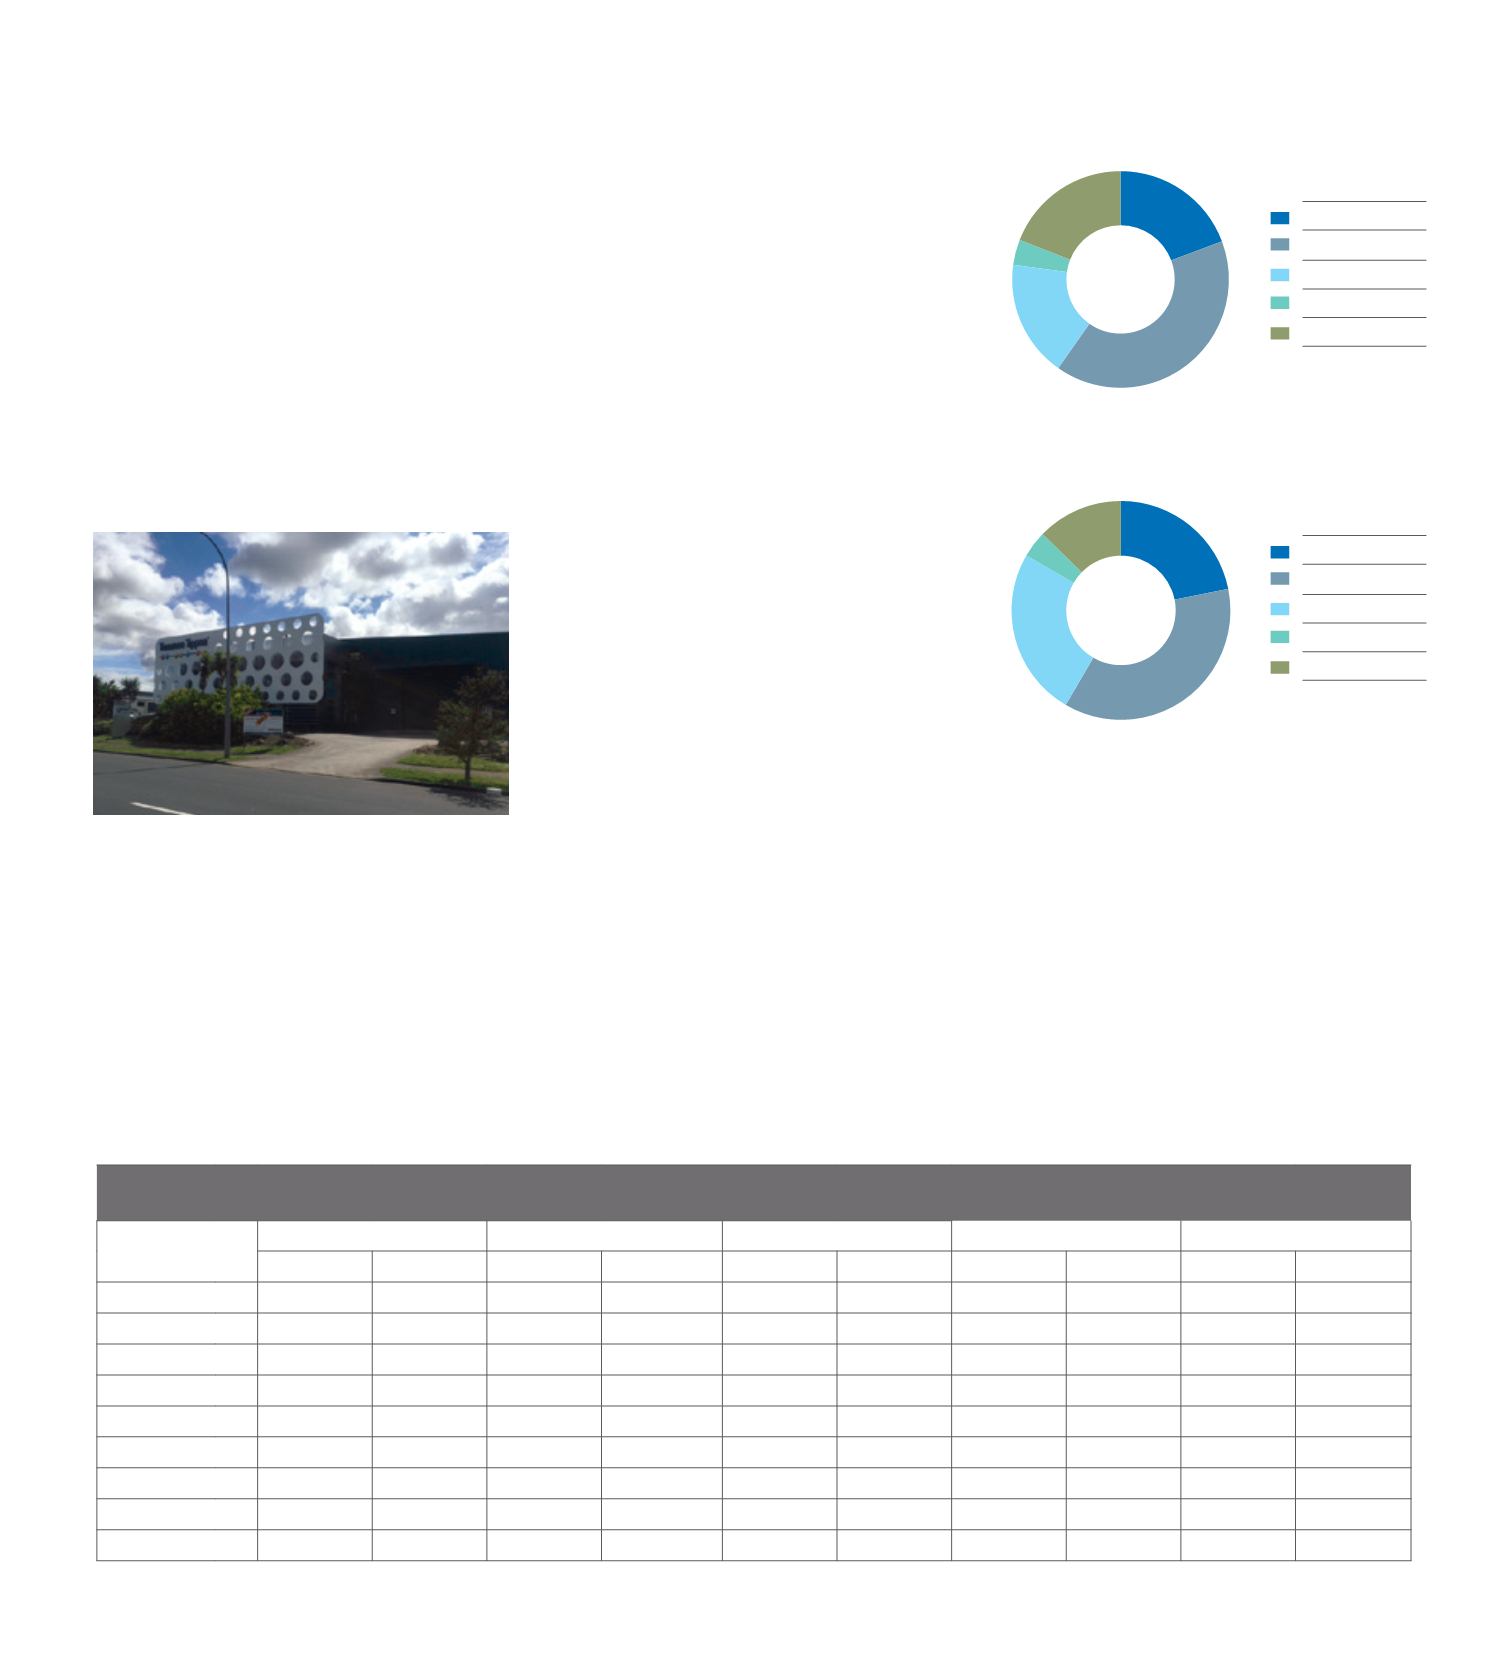
The abovementioned charts outline the total number of
properties and total floor area per suburb. For the South
Auckland Industrial areas, East Tamaki leads the way with
40% of the total number of industrial properties and caters
for 37% of the total floor area. East Tamaki is also the
home to the Goodman owned Highbrook Business Park
development which commenced construction 2004 and
has been very successful. Set over 107 hectares it delivers
prime commercial and industrial design with build and
leasing space options.
Mount Wellington has slightly fewer numbers of
industrial buildings than Onehunga but is 12% higher on
total floor area. Mt Wellington is more so known for the
larger format buildings and sits in a strategic transport
location where Onehunga is positioned close to a small
port, is an older light industrial area featuring dated low
stud warehousing configurations.
Development appears not to be happening quickly
enough and is hindered by the shortage of suitable land
to build upon. The construction window creates a time lag
of supply to meet market demand. Development is also
hindered by the high price of land which floats around
$475 - $500 a square meter for more centralised localities,
which has the effect of squeezing margins for spec builds.
Knight Frank have seen a growing level of interest
surrounding the high stud clear span industrial space
of recent however, due to the lack of stock prospective
purchasers, investors and tenants alike are having to be
content with the lower grade properties to which even in
this bracket has strong demand.
Spec-builds are typically being leased before construction
has finished and off-market transactions are becoming an
increasing feature in the market place. An example of an
off market transaction was that of an industrial building
on Kerwyn Ave, East Tamaki which comprises 1,500 sqm
warehouse and 430 sqm office. Let for a term of seven
years with two rights of renewal for five years it shows that
tenants will secure long term leases for the right property
to secure their position in a tight market.
Penrose
East Tamaki
Mt Wellington
Manukau
Onehunga
Penrose
East Tamaki
Mt Wellington
Manukau
Onehunga
Figure 3.
Total floor area per suburb
Figure 2.
Total number of properties per suburb
Table 2.
Total Number of Industrial properties and total floor area
Penrose
Onehunga
East Tamaki
Mt Wellington
Manukau / Wiri
#
Area
#
Area
#
Area
#
Area
#
Area
Heavy
IH
6
78156
10
18220
11
72088
3
16697
6
18006
Light
IL
272
440983
478
355535
780
925088
269
540390
8
5391
Food
IF
0
0
0
0
2
5605
0
0
0
0
Noxious
IN
1
2570
4
8758
11
16466
0
0
0
0
Service
IS
30
9232
8
12024
124
41755
12
60694
79
36160
Warehouse IW
278
491894
99
230562
371
799505
251
651876
38
162485
Mixed
IX
75
250638
43
115655
76
271989
54
184552
2
6520
Vacant Land IV
22
0
34
0
61
0
29
0
1
0
TOTAL
684 1273473
676
740754
1436 2132496
618 1454209
134
228562
676,
19%
684,
19%
134,
4%
618,
17%
1436,
41%
740,754,
13%
228,562,
4%
1,273,473,
22%
2,132,496,
36%
1,454,209,
25%
9
AUCKLAND
KnightFrank.co.nz